This project implements object detection Average Precision metrics using COCO style.
With Detection Metrics you can easily compute all 12 COCO metrics given the bounding boxes output by your object detection model:
Average Precision (AP):
- AP: AP at IoU=.50:.05:.95
- APIoU=.50: AP at IoU=.50 (similar to mAP PASCAL VOC metric)
- APIoU=.75%: AP at IoU=.75 (strict metric)
AP Across Scales:
- APsmall: AP for small objects: area < 322
- APmedium: AP for medium objects: 322 < area < 962
- APlarge: AP for large objects: area > 962
Average Recall (AR):
- ARmax=1: AR given 1 detection per image
- ARmax=10: AR given 10 detections per image
- ARmax=100: AR given 100 detections per image
AR Across Scales:
- ARsmall: AR for small objects: area < 322
- ARmedium: AR for medium objects: 322 < area < 962
- ARlarge: AR for large objects: area > 962
How to use detection metrics?
Basically, you just need to create your ground-truth data and prepare your evaluation loop to output the boxes, confidences and classes in the required format. Follow these steps:
Step 1: Prepare your ground-truth dataset
Convert your ground-truth annotations in JSON following the COCO format. COCO ground-truth annotations are represented in a dictionary containing 3 elements: "images", "annotations" and "categories". The snippet below shows an example of the dictionary, and you can find here.
{
    "images": [
        {
            "id": 212226,
            "width": 500,
            "height": 335
        },
        ...
    ],
    "annotations": [
        {
            "id": 489885,
            "category_id": 1,
            "iscrowd": 0,
            "image_id": 212226,
            "area": 12836,
            "bbox": [
                235.6300048828125, # x
                84.30999755859375, # y
                158.08999633789062, # w
                185.9499969482422 # h
            ]
        },
        ....
    ],
    "categories": [
        {
            "supercategory": "none",
            "id": 1,
            "name": "person"
        },
        ...
    ]
}
You do not need to save the JSON in disk, you can keep it in memory as a dictionary.
Step 2: Load the object detection evaluator:
Install Hugging Face's Evaluate module (pip install evaluate) to load the evaluator. More instructions here.
Load the object detection evaluator passing the JSON created on the previous step through the argument json_gt:
evaluator = evaluate.load("rafaelpadilla/detection_metrics", json_gt=ground_truth_annotations, iou_type="bbox")
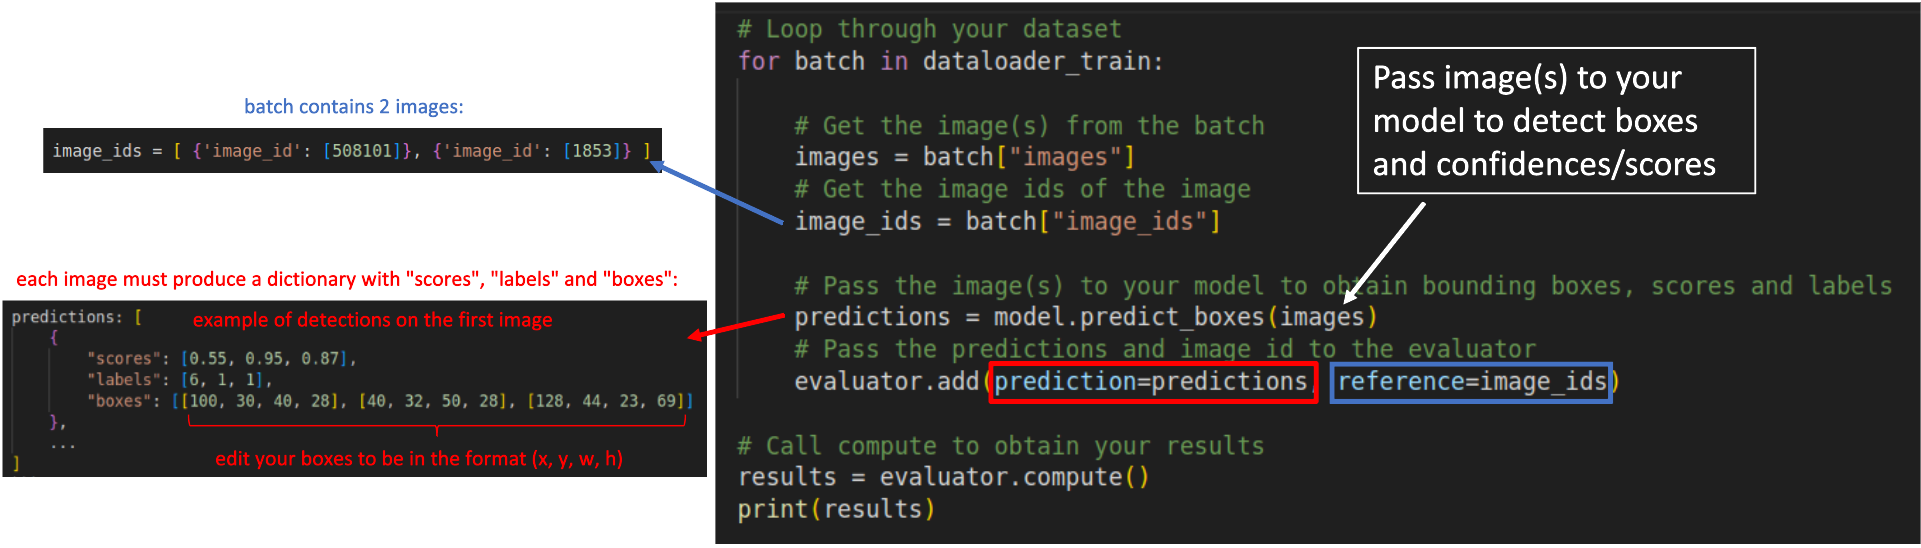
Step 3: Loop through your dataset samples to obtain the predictions:
    # Loop through your dataset
    for batch in dataloader_train:

        # Get the image(s) from the batch
        images = batch["images"]
        # Get the image ids of the image
        image_ids = batch["image_ids"]

        # Pass the image(s) to your model to obtain bounding boxes, scores and labels
        predictions = model.predict_boxes(images)
        # Pass the predictions and image id to the evaluator
        evaluator.add(prediction=predictions, reference=image_ids)

    # Call compute to obtain your results
    results = evaluator.compute()
    print(results)
Regardless your model's architecture, your predictions must be converted to a dictionary containing 3 fields as shown below:
predictions: [
    {
        "scores": [0.55, 0.95, 0.87],
        "labels": [6, 1, 1],
        "boxes": [[100, 30, 40, 28], [40, 32, 50, 28], [128, 44, 23, 69]]
    },
    ...
]
scores: List or torch tensor containing the confidences of your detections. A confidence is a value between 0 and 1.labels: List or torch tensor with the indexes representing the labels of your detections.boxes: List or torch tensors with the detected bounding boxes in the formatx,y,w,h.
The reference added to the evaluator in each loop is represented by a list of dictionaries containing the image id of the image in that batch.
For example, in a batch containing two images, with ids 508101 and 1853, the reference argument must receive image_ids in the following format:
image_ids = [ {'image_id': [508101]}, {'image_id': [1853]} ]
After the loop, you have to call evaluator.compute() to obtain your results in the format of a dictionary. The metrics can also be seen in the prompt as:
IoU metric: bbox
 Average Precision  (AP) @[ IoU=0.50:0.95 | area=   all | maxDets=100 ] = 0.415
 Average Precision  (AP) @[ IoU=0.50      | area=   all | maxDets=100 ] = 0.613
 Average Precision  (AP) @[ IoU=0.75      | area=   all | maxDets=100 ] = 0.436
 Average Precision  (AP) @[ IoU=0.50:0.95 | area= small | maxDets=100 ] = 0.209
 Average Precision  (AP) @[ IoU=0.50:0.95 | area=medium | maxDets=100 ] = 0.449
 Average Precision  (AP) @[ IoU=0.50:0.95 | area= large | maxDets=100 ] = 0.601
 Average Recall     (AR) @[ IoU=0.50:0.95 | area=   all | maxDets=  1 ] = 0.333
 Average Recall     (AR) @[ IoU=0.50:0.95 | area=   all | maxDets= 10 ] = 0.531
 Average Recall     (AR) @[ IoU=0.50:0.95 | area=   all | maxDets=100 ] = 0.572
 Average Recall     (AR) @[ IoU=0.50:0.95 | area= small | maxDets=100 ] = 0.321
 Average Recall     (AR) @[ IoU=0.50:0.95 | area=medium | maxDets=100 ] = 0.624
 Average Recall     (AR) @[ IoU=0.50:0.95 | area= large | maxDets=100 ] = 0.794
The scheme below illustrates how your for loop should look like: